Market Outlook
November 20, 2017
Market Cues
Domestic Indices
Chg (%)
(Pts)
(Close)
Indian markets are likely to open flat tracking global indices and SGX Nifty.
BSE Sensex
0.7
236
33,343
While selling pressure was relatively subdued, U.S. stocks saw modest weakness
Nifty
0.7
69
10,284
during trading on Friday. The major averages all moved to the downside, with the
Mid Cap
1.0
169
16,673
tech-heavy Nasdaq pulling back off the record closing high set in the previous
Small Cap
0.8
142
17,605
session.
Bankex
1.2
339
29,242
The European markets fluctuated between small gains and losses during Friday's
session, but ended the day in the red. Markets were under pressure as the Euro
Global Indices
Chg (%)
(Pts)
(Close)
gained ground against the U.S. dollar following reports that Special Counsel Robert
Mueller issued subpoenas to over a dozen top Trump campaign officials in mid-
Dow Jones
(0.4)
(100)
23,358
October, calling for documents and emails related to Russia.
Nasdaq
(0.2)
(11)
6,783
FTSE
(0.1)
(6)
7,381
Indian markets posted strong gains for the second day in a row on Friday, bonds
Nikkei
0.2
46
22,397
rallied and the rupee strengthened sharply against the dollar after Moody's Investors
Service upgraded India's sovereign rating for the first time in 14 years.
Hang Seng
0.6
180
29,199
Shanghai Com
(0.5)
(16)
3,383
News Analysis
Advances / Declines
BSE
NSE
L&T Construction bags `8,650cr order to build Mumbai Trans Harbour Link
Advances
1,623
1,109
Detailed analysis on Pg2
Declines
1,143
632
Unchanged
174
75
Investor’s Ready Reckoner
Key Domestic & Global Indicators
Volumes (` Cr)
Stock Watch: Latest investment recommendations on 150+ stocks
BSE
4,676
Refer Pg5 onwards
NSE
36,804
Top Picks
CMP
Target
Upside
Company
Sector
Rating
Net Inflows (` Cr)
Net
Mtd
Ytd
(`)
(`)
(%)
Blue Star
Capital Goods
Buy
695
867
24.8
FII
289
14,403
52,855
Dewan Housing Finance
Financials
Accumulate
636
712
12.0
MFs
2,326
3,825
99,236
Asian Granito
Other
Buy
490
570
16.4
Navkar Corporation
Other
Buy
181
265
46.8
Top Gainers
Price (`)
Chg (%)
KEI Industries
Capital Goods Accumulate
339
380
12.0
Renuka
18
13.9
More Top Picks on Pg4
Gati
131
9.8
Key Upcoming Events
Jubilant
676
9.5
Previous
Consensus
Date
Region
Event Description
Reading
Expectations
Adanient
156
8.0
Nov16
US
Initial Jobless claims
249.00
Polaris
357
7.4
Nov16
US
Existing home sales
5.39
5.40
Nov16
Euro Zone Euro-Zone Consumer Confidence
(1.00)
(1.00)
Top Losers
Price (`)
Chg (%)
Nov17
Germany PMI Manufacturing
60.60
60.30
Videoind
14
(2.7)
Nov17
Germany GDP nsa (YoY)
2.30
2.30
More Events on Pg7
Techm
485
(2.7)
Ltts
918
(2.7)
Gppl
131
(2.6)
Bbtc
1,459
(2.5)
As on November, 17 2017
Market Outlook
November 20, 2017
News Analysis
L&T Construction bags `8,650cr order to build Mumbai Trans
Harbour Link
Larsen & Toubro announced that the heavy civil infrastructure business vertical of
L&T Construction bagged an order worth `8,650cr from Mumbai Metropolitan
Region Development Authority (MMRDA) for the construction of Mumbai Trans
Harbour Link, Package 01 & 03. The project involves the construction of a 21.8
km bridge connecting Mumbai mainland with Navi Mumbai.
The package -01 of the contract involves the construction of a multi-level
interchange at Sewri and a 6-lane marine bridge from Sewri to 10.38 Km into the
Mumbai bay, crossing over the Sewri mudflats, Pir Pau Jetty and Thane Creek
channels. The contract, secured in partnership with IHI Corporation, Japan
involves the construction of an orthotropic steel deck crossing the various
obligatory navigation channels which will be first of its kind in India.
The package-03, won by L&T on a standalone basis, involves the construction of a
3.6 km, 6-lane land bridge at Navi Mumbai connecting National Highway-4B and
State Highway-54 apart from the construction of Interchanges, Rail Over Bridges
and Toll Plazas.
The proposed Mumbai Trans Harbour Link will serve as an economic gateway to
Navi Mumbai connecting to Nhava Sheva Port, the Mumbai Pune Expressway and
the Mumbai Goa Highway.
DFC Standard Life Insurance Company Ltd
We had given “SUBSCRIBE” rating to the HDFC Life IPO, At the upper band of
`290 the issue was valued at 4.2x of 2QFY2018 embedded value (EV) of
`14,011cr, a bit higher than close listed player SBI Life and ICICI Pru which is
trading at 3.6x and 3.3x of 2QFY2018 EV respectively. Slight premium is justified,
considering, consistent growth across premium categories, improving dividend
pay-out over last 4 years, strong parentage trusted brand name, highest VNB
margin (22% for FY2017) and well-balanced business mix.
Stock listed with an over 7% premium (`311) against its issue price of `290. At
yesterday closing price of `344, it is it closed 18.71% premium to its issue price
and 5x of 2QFY18 embedded Value. We recommend investor with listing gain
respective can book profit.
Economic and Political News
Govt raises import duty on palm oil, soyoil to support farmers
Foreign exchange earnings from tourism surge to `2,254cr in October
India's debt-to-GDP ratio much higher than median of Baa2-rated
economies
Corporate News
Infosys' `13,000cr buyback begins Nov 30; Nilekani, Murthy to take part
IndiGo takes delivery of its first ATR 72-600 aircraft
Hinduja Leyland Finance sees gross income rising to `2,000 cr this fiscal
Market Outlook
November 20, 2017
Top Picks HHHHH
Market Cap
CMP
Target
Upside
Company
Rationale
(` Cr)
(`)
(`)
(%)
Strong growth in domestic business due to its leade`hip
in acute therapeutic segment. Alkem expects to launch
Alkem Laboratories
23,553
1,970
2,125
7.9
more products in USA, which bodes for its international
business.
We expect the company would report strong profitability
Asian Granito
1,473
490
570
16.4
owing to better product mix, higher B2C sales and
amalgamation synergy.
Favorable outlook for the AC industry to augur well for
Cooling products business which is out pacing the
Blue Star
6,659
695
867
24.8
market growth. EMPPAC division's profitability to
improve once operating environment turns around.
With a focus on the low and medium income (LMI)
consumer segment, the company has increased its
Dewan Housing Finance
19,930
636
712
12.0
presence in tier-II & III cities where the growth
opportunity is immense.
Loan growth is likely to pick up after a sluggish FY17.
Lower credit cost will help in strong bottom-line growth.
Karur Vysya Bank
7,276
120
180
49.5
Increasing share of CASA will help in NIM
improvement.
High order book execution in EPC segment, rising B2C
KEI Industries
2,659
339
380
12.0
sales and higher exports to boost the revenues and
profitability
Expected to benefit from the lower capex requirement
Music Broadcast
2,084
365
434
18.8
and 15 year long radio broadcast licensing.
Massive capacity expansion along with rail advantage
Navkar Corporation
2,718
181
265
46.8
at ICD as well CFS augur well for the company
Strong brands and distribution network would boost
Siyaram Silk Mills
2,687
573
650
13.4
growth going ahead. Stock currently trades at an
inexpensive valuation.
Market leadership in Hindi news genre and no.
2
viewership ranking in English news genre, exit from the
TV Today Network
2,130
357
435
21.8
radio business, and anticipated growth in ad spends by
corporate to benefit the stock.
After GST, the company is expected to see higher
volumes along with improving product mix. The Gujarat
Maruti Suzuki
2,51,956
8,341
8,890
6.6
plant will also enable higher operating leverage which
will be margin accretive.
We expect loan book to grow at 24.3% over next two
GIC Housing
2,362
439
655
49.3
year; change in borrowing mix will help in NIM
improvement..
Source: Company, Angel Research
Market Outlook
November 20, 2017
Key Upcoming Events
Global economic events release calendar
Bl oomberg Data
D ate
Time
C ountry
Event Description
Unit
Period
L ast Reporte d
E stimate d
Nov 21, 2017
7:00 PM US
Initial Jobless claims
Thousands
Nov 18
249.00
Nov 22, 2017
8:30 PM US
Existing home sales
Million
Oct
5.39
5.40
8:30 PM Euro Zone
Euro-Zone Consumer Confidence
Value
Nov A
(1.00)
(1.00)
Nov 23, 2017
2:00 PM Germany
PMI Manufacturing
Value
Nov P
60.60
60.30
12: 30 PM Germany
GDP nsa (YoY)
% Change
3Q F
2.30
2.30
2:00 PM Germany
PMI Services
Value
Nov P
54.70
55.00
3:00 PM UK
GDP (YoY)
% Change
3Q P
1.50
1.50
Nov 27, 2017
8:30 PM US
New home sales
Thousands
Oct
667.00
615.00
Nov 28, 2017
8:30 PM US
Consumer Confidence
S.A./ 1985=100
Nov
125.90
123.00
Nov 29, 2017
7:00 PM US
GDP Qoq (Annualise d)
% Change
3Q S
3.00
3.40
Nov 30, 2017
2:25 PM Germany
Unempl oyment change (000's)
Thousands
Nov
(11.00)
6:30 AM China
PMI Manufacturing
Value
Nov
51.60
Dec 01, 2017
3:00 PM UK
PMI Manufacturing
Value
Nov
56.30
Dec 05, 2017
3:30 PM Euro Zone
Euro-Zone GDP s.a. (QoQ)
% Change
3Q F
0.60
Dec 06, 2017
2:30 PM India
RBI Reverse Re po rate
%
Dec 6
5.75
2:30 PM India
RBI Cash Reserve ratio
%
Dec 6
4.00
2:30 PM India
RBI Repo rate
%
Dec 6
6.00
Dec 08, 2017
3:00 PM UK
Industrial Production (YoY)
% Change
Oct
2.50
India
Imports YoY%
% Change
Nov
7.60
India
Exports YoY%
% Change
Nov
(1.10)
China
Exports YoY%
% Change
Nov
6.90
7:00 PM US
Change in N onfarm payrolls
Thousands
Nov
261.00
7:00 PM US
Unnemployment rate
%
Nov
4.10
Dec 09, 2017
7:00 AM China
Consumer Price Index (YoY)
% Change
Nov
1.90
Source: Bloomberg, Angel Research
Market Outlook
November 20, 2017
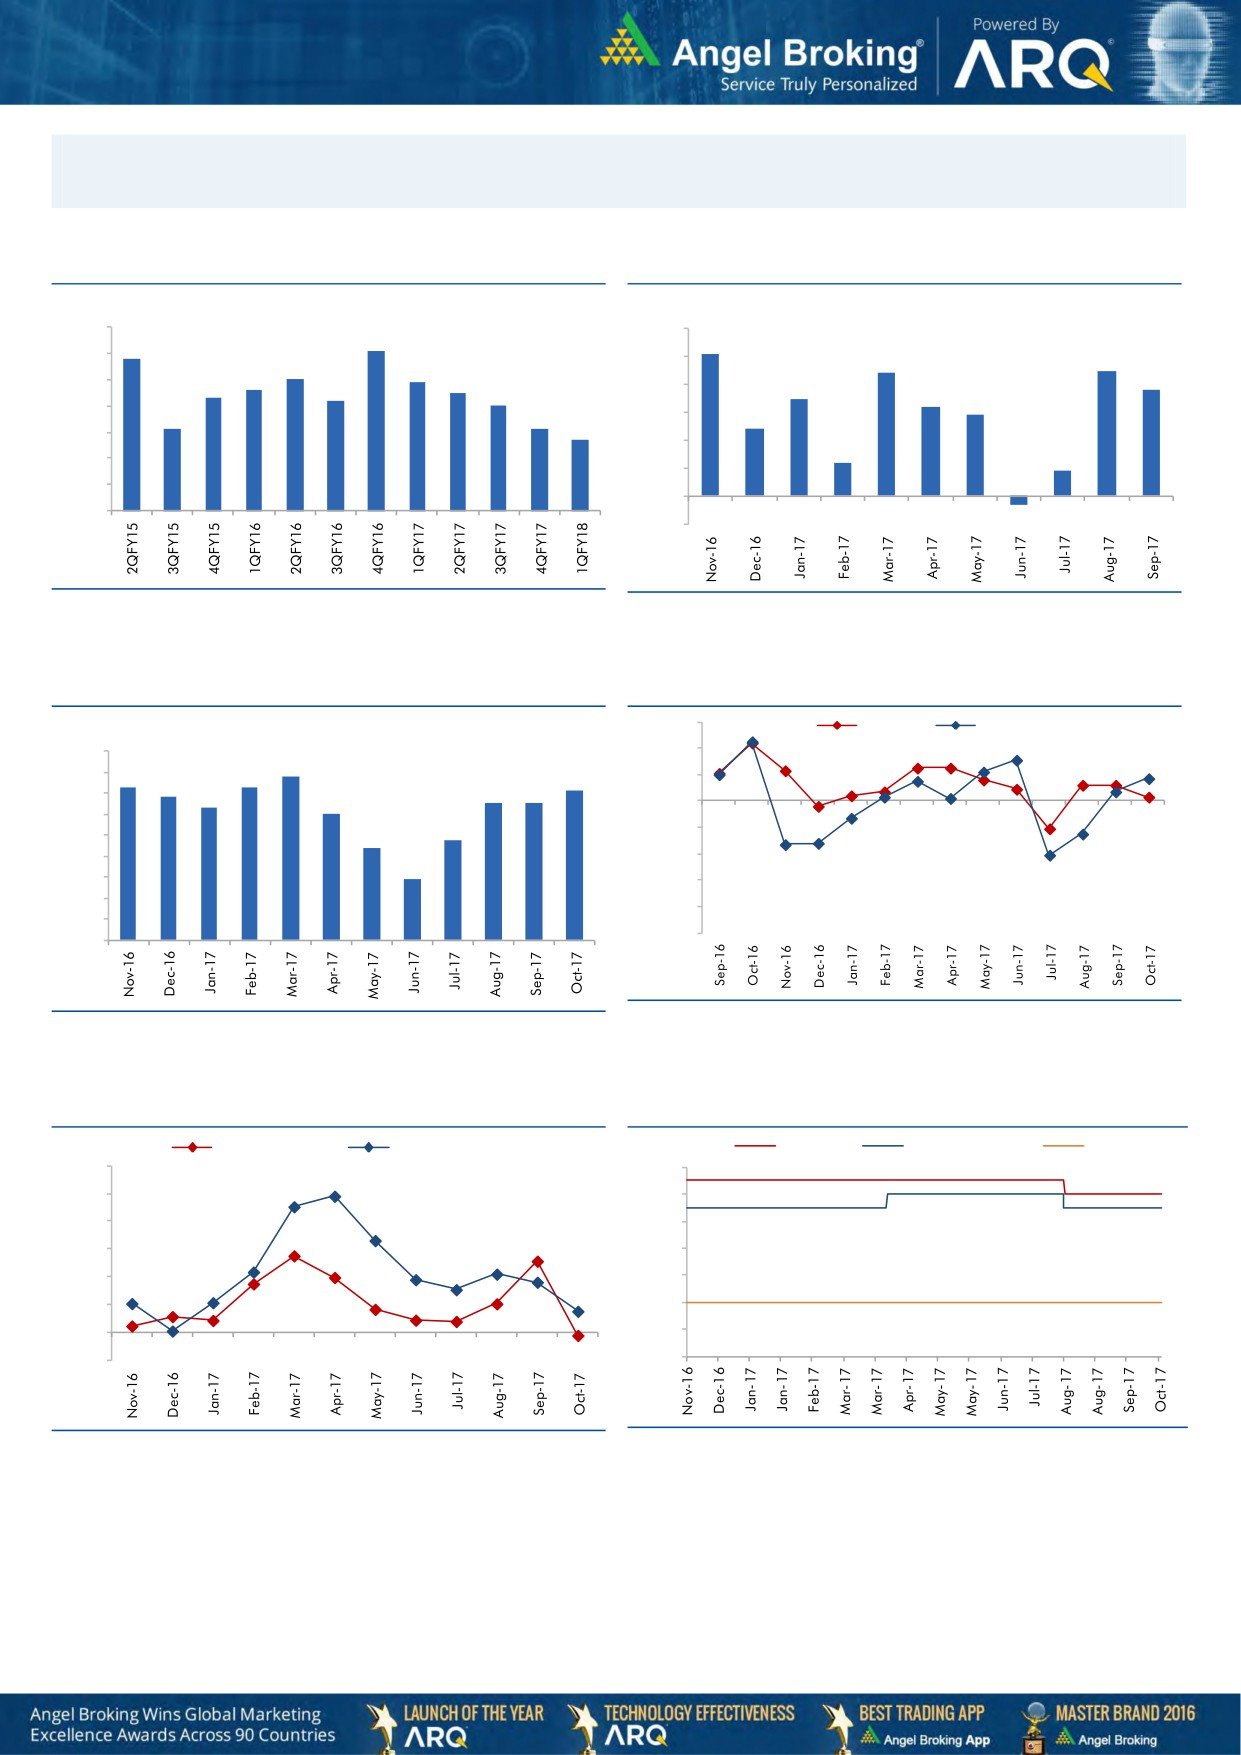
Macro watch
Exhibit 1: Quarterly GDP trends
Exhibit 2: IIP trends
(%)
(%)
10.0
6.0
9.1
5.1
8.8
9.0
5.0
4.4
4.5
8.0
7.9
7.6
7.5
3.8
8.0
7.3
7.2
4.0
3.5
7.0
3.2
2.9
7.0
6.1
6.1
3.0
2.4
5.7
6.0
2.0
1.2
5.0
0.9
1.0
4.0
-
3.0
(1.0)
(0.3)
Source: CSO, Angel Research
Source: MOSPI, Angel Research
Exhibit 3: Monthly CPI inflation trends
Exhibit 4: Manufacturing and services PMI
56.0
Mfg. PMI
Services PMI
(%)
4.5
54.0
3.9
4.0
3.6
3.7
3.6
52.0
3.4
3.2
3.3
3.3
3.5
3.0
50.0
3.0
2.4
48.0
2.5
2.2
2.0
46.0
1.5
1.5
44.0
1.0
42.0
0.5
40.0
-
Source: Market, Angel Research; Note: Level above 50 indicates expansion
Source: MOSPI, Angel Research
Exhibit 5: Exports and imports growth trends
Exhibit 6: Key policy rates
(%)
Exports yoy growth
Imports yoy growth
(%)
Repo rate
Reverse Repo rate
CRR
60.0
6.50
50.0
6.00
40.0
5.50
30.0
5.00
20.0
4.50
10.0
4.00
0.0
3.50
(10.0)
3.00
Source: Bloomberg, Angel Research
Source: RBI, Angel Research
Market Outlook
November 20, 2017
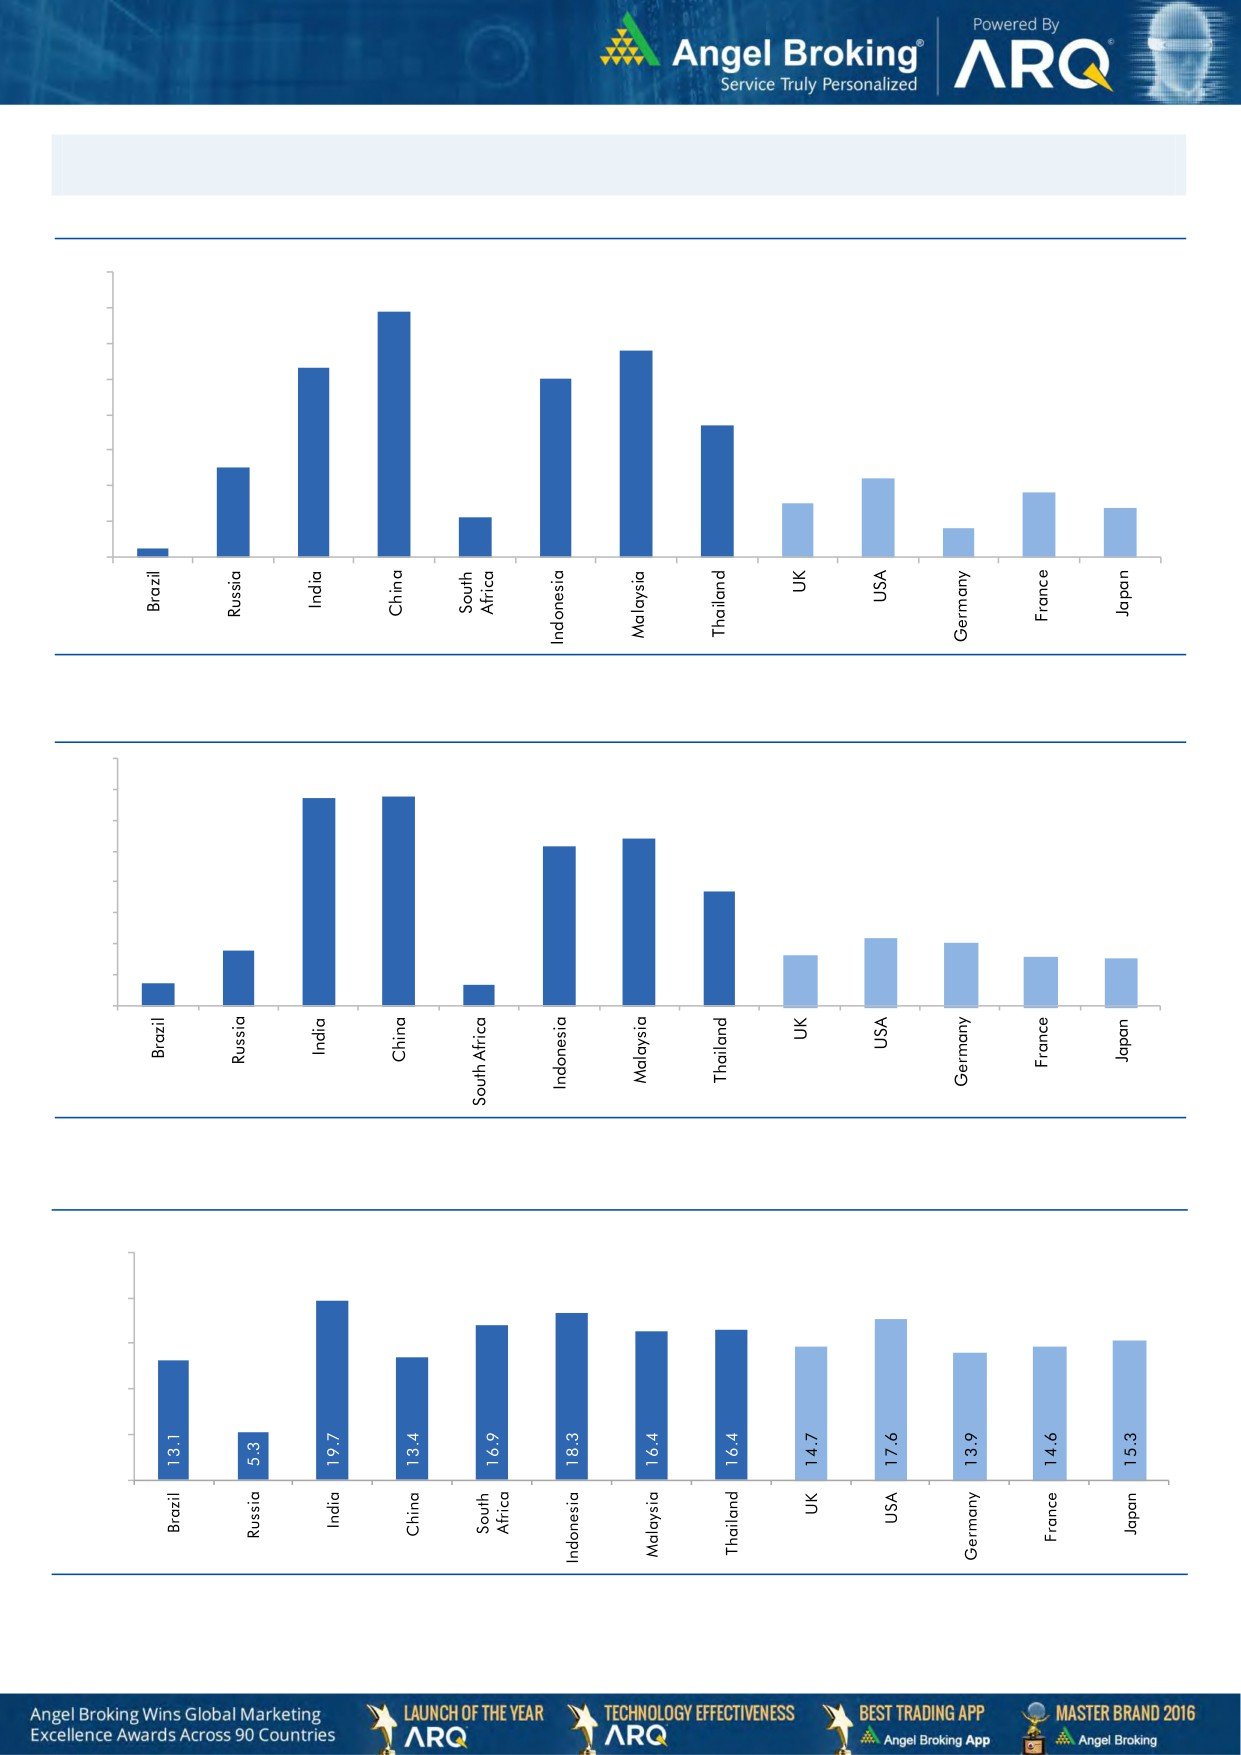
Global watch
Exhibit 1: Latest quarterly GDP Growth (%, yoy) across select developing and developed countries
(%)
8.0
6.9
7.0
5.8
6.0
5.3
5.0
5.0
1.1
3.7
4.0
2.5
3.0
2.2
1.8
2.0
1.5
1.4
0.8
1.0
0.3
-
Source: Bloomberg, Angel Research
Exhibit 2: 2017 GDP Growth projection by IMF (%, yoy) across select developing and developed countries
(%)
6.7
6.8
7.0
6.0
5.4
5.2
5.0
3.7
4.0
3.0
1.8
2.2
2.0
1.7
1.6
2.0
0.7
1.5
0.7
1.0
-
Source: IMF, Angel Research
Exhibit 3: One year forward P-E ratio across select developing and developed countries
(x)
25.0
20.0
15.0
10.0
5.0
-
Source: IMF, Angel Research
Market Outlook
November 20, 2017
Exhibit 4: Relative performance of indices across globe
Returns (%)
C ountry
Name of index
Closing price
1M
3M
1YR
Brazil
Bovespa
73,437
(4.5)
7.4
23.1
Russia
Micex
2,132
1.9
10.4
3.6
India
Nifty
10,284
0.5
3.9
26.8
China
Shanghai Composite
3,383
0.0
4.5
8.1
South Africa
Top 40
53,909
4.2
10.2
25.1
Mexico
Mexbol
47,857
(4.6)
(6.3)
6.7
Indonesia
LQ45
1,011
2.4
2.9
9.3
Malaysia
KLCI
1,722
(1.6)
(2.8)
4.5
Thailand
SET 50
1,089
(1.5)
9.1
15.4
USA
Dow Jones
23,358
0.9
7.8
23.8
UK
FTSE
7,381
(2.2)
0.8
8.9
Japan
Nikkei
22,397
5.0
13.5
28.9
Germany
DAX
12,994
(0.0)
6.5
21.3
France
CAC
5,319
(1.2)
4.6
16.9
Source: Bloomberg, Angel Research p68in4
Stock Watch
November 20, 2017
Company Name
Reco
CMP
Target
Mkt Cap
Sales ( Čcr )
OPM(%)
EPS (Č)
PER(x)
P/BV(x)
RoE(%)
EV/Sales(x)
(Č)
Price ( Č)
( Č cr )
FY18E FY19E
FY18E
FY19E
FY18E
FY19E
FY18E
FY19E
FY18E
FY19E
FY18E
FY19E
FY18E
FY19E
Agri / Agri Chemical
Rallis
Reduce
230
209
4,473
1,873
2,099
15.0
15.0
9.5
10.5
24.2
21.9
3.7
3.3
15.8
16.0
2.3
2.1
United Phosphorus
Accumulate
725
820
36,848
18,922
21,949
18.0
18.5
36.2
45.6
20.0
15.9
4.2
3.5
22.7
23.8
2.1
1.8
Auto & Auto Ancillary
Ashok Leyland
Accumulate
116
127
33,911
23,339
27,240
10.1
10.8
4.7
6.2
24.9
18.6
5.0
4.4
20.0
23.6
1.4
1.2
Bajaj Auto
Neutral
3,212
-
92,946
23,936
27,955
19.5
20.1
142.7
167.3
22.5
19.2
4.9
4.4
21.8
22.8
3.5
2.9
Bharat Forge
Buy
697
875
32,442
7,637
8,755
21.7
23.2
36.1
47.3
19.3
14.8
3.5
3.0
18.5
20.8
4.1
3.5
Eicher Motors
Neutral
30,638
-
83,403
19,043
22,837
19.5
19.9
835.4
1,019.0
36.7
30.1
13.7
10.6
40.9
37.8
4.2
3.5
Gabriel India
Neutral
193
-
2,773
1,782
2,033
9.7
10.2
7.1
8.9
27.2
21.8
5.5
4.6
21.0
22.2
1.5
1.3
Hero Motocorp
Accumulate
3,635
4,129
72,586
32,239
36,878
16.0
15.6
184.4
206.5
19.7
17.6
6.2
5.4
31.3
30.7
2.0
1.7
Jamna Auto Industries Neutral
59
-
2,367
1,441
1,662
14.4
14.8
13.9
17.6
4.3
3.4
1.2
1.0
30.0
31.0
1.6
1.4
Mahindra and Mahindra Neutral
1,417
-
88,058
46,971
53,816
13.6
14.0
67.7
79.8
20.9
17.8
3.0
2.7
15.0
15.9
1.8
1.5
Maruti
Accumulate
8,341
8,890
251,956
80,985
97,917
15.6
16.9
282.3
370.4
29.6
22.5
6.4
5.2
21.8
23.1
2.8
2.2
Minda Industries
Neutral
1,053
-
9,100
4,328
5,084
11.0
11.9
27.3
36.4
38.6
28.9
8.2
6.4
23.1
25.6
2.2
1.9
Motherson Sumi
Neutral
360
-
75,828
55,937
64,445
10.8
11.4
16.9
21.1
21.3
17.1
4.8
4.9
25.2
25.4
1.4
1.2
Tata Motors
Neutral
421
-
121,687
303,167
343,649
11.8
13.8
33.1
54.7
12.7
7.7
2.1
1.7
16.9
23.0
0.5
0.4
TVS Motor
Neutral
709
-
33,665
13,992
16,216
9.0
9.4
17.1
20.3
41.6
34.9
11.0
8.5
29.7
27.7
2.3
2.0
Amara Raja Batteries
Accumulate
799
858
13,655
6,140
7,122
14.3
15.6
29.3
39.0
27.3
20.5
4.7
3.9
17.1
19.0
2.2
1.9
Exide Industries
Neutral
201
-
17,081
8,689
9,854
15.1
15.2
9.7
11.0
20.8
18.3
3.7
3.3
15.7
16.1
1.7
1.5
Apollo Tyres
Neutral
236
-
13,518
15,739
17,326
13.3
14.6
20.4
26.7
11.6
8.9
1.4
1.2
20.4
26.7
1.1
1.0
Ceat
Neutral
1,777
-
7,188
6,661
7,717
11.1
14.2
116.2
178.2
15.3
10.0
2.7
2.2
15.2
21.3
1.2
1.0
JK Tyres
Neutral
144
-
3,272
8,318
9,239
16.2
16.4
21.0
27.5
6.9
5.3
1.3
1.1
19.1
20.4
0.8
0.7
Swaraj Engines
Neutral
1,935
-
2,404
788
889
16.4
16.5
71.6
81.0
27.0
23.9
7.8
7.2
29.6
31.0
2.7
2.3
Subros
Neutral
247
-
1,481
1,855
2,135
11.6
11.8
10.3
14.7
24.1
16.9
3.7
3.1
15.8
19.1
1.0
0.9
Capital Goods
BEML
Neutral
1,628
-
6,778
4,286
5,194
7.1
8.2
42.9
58.1
37.9
28.0
3.1
2.8
7.6
8.7
1.6
1.3
Bharat Electronics
Neutral
179
-
43,906
10,258
12,470
19.6
19.5
7.3
8.6
24.5
20.8
0.5
0.4
20.4
21.9
3.8
3.1
Voltas
Neutral
610
-
20,197
6,778
8,004
9.6
11.0
17.1
22.4
35.7
27.3
8.5
7.5
17.7
19.8
2.7
2.3
BHEL
Neutral
88
-
32,217
33,200
39,167
6.8
9.5
6.2
11.2
14.2
7.8
0.7
0.6
4.6
8.0
0.5
0.4
Blue Star
Buy
695
867
6,659
5,220
6,207
6.3
6.6
16.8
22.3
41.4
31.2
8.2
7.3
19.9
23.3
1.2
1.0
CG Power and Industrial
Neutral
84
-
5,233
6,555
7,292
7.5
7.5
-
0.8
8,350.0
104.4
1.3
1.3
0.1
1.2
0.9
0.8
Solutions
Greaves Cotton
Neutral
122
-
2,983
1,778
1,993
14.7
15.1
8.1
9.1
15.1
13.4
3.4
3.2
21.8
23.6
1.4
1.3
Stock Watch
November 20, 2017
Company Name
Reco
CMP
Target
Mkt Cap
Sales ( Čcr )
OPM(%)
EPS (Č)
PER(x)
P/BV(x)
RoE(%)
EV/Sales(x)
(Č)
Price ( Č)
( Č cr )
FY18E FY19E
FY18E
FY19E
FY18E
FY19E
FY18E
FY19E
FY18E
FY19E
FY18E
FY19E
FY18E
FY19E
Capital Goods
KEC International
Buy
292
350
7,516
9,779
11,113
9.4
9.8
14.2
18.2
20.6
16.1
3.9
3.2
21.1
22.1
1.0
0.9
KEI Industries
Accumulate
339
380
2,659
3,001
3,391
10.0
10.0
13.0
16.1
26.1
21.1
4.7
3.9
18.2
18.7
1.1
0.9
Thermax
Neutral
1,021
-
12,166
4,125
4,747
10.3
10.8
26.7
31.5
38.2
32.4
4.3
3.9
11.2
12.0
2.7
2.3
VATech Wabag
Buy
547
681
2,984
3,867
4,126
9.6
10.0
34.9
39.8
15.7
13.7
2.6
2.2
17.7
17.5
0.8
0.7
Cement
ACC
Neutral
1,766
-
33,162
12,255
13,350
13.5
14.3
58.0
66.2
30.5
26.7
3.6
3.4
11.5
12.2
2.7
2.5
Ambuja Cements
Neutral
274
-
54,496
10,250
11,450
17.5
19.0
7.2
8.3
38.1
33.1
2.7
2.6
7.0
7.8
5.1
4.5
India Cements
Neutral
177
-
5,442
6,135
6,750
14.8
15.2
8.5
11.5
20.8
15.4
1.0
1.0
4.8
6.2
1.2
1.1
JK Cement
Neutral
1,083
-
7,570
4,150
4,775
19.2
20.0
49.0
63.5
22.1
17.1
3.5
3.0
17.0
18.5
2.3
1.9
J K Lakshmi Cement
Neutral
428
-
5,035
3,422
3,757
15.5
17.0
13.5
23.2
31.7
18.4
3.3
2.8
10.8
15.5
1.9
1.6
Orient Cement
Neutral
165
-
3,380
2,215
3,233
16.8
17.0
5.9
6.9
28.0
23.9
2.1
2.0
10.8
10.1
2.5
1.7
UltraTech Cement
Neutral
4,277
-
117,432
28,250
35,150
20.2
23.5
77.5
122.2
55.2
35.0
4.7
4.2
9.6
14.8
4.6
3.7
Construction
KNR Constructions
Neutral
268
-
3,762
1,846
2,203
14.5
14.5
12.1
13.7
22.1
19.6
1.2
1.1
17.5
16.7
2.1
1.7
Larsen & Toubro
Neutral
1,221
-
171,042
95,787
109,476
10.2
11.6
44.5
50.8
27.5
24.1
3.4
3.2
12.9
13.1
2.3
2.1
Gujarat Pipavav Port
Neutral
131
-
6,333
739
842
61.6
62.7
5.1
6.2
25.7
21.3
3.2
3.1
12.7
14.9
8.0
6.9
PNC Infratech
Neutral
182
-
4,679
2,040
2,935
13.0
13.0
6.4
9.0
28.5
20.3
0.7
0.7
9.7
12.2
2.3
1.6
Simplex Infra
Neutral
513
-
2,539
6,012
6,619
11.6
11.7
21.1
31.0
24.4
16.6
1.7
1.6
6.5
8.6
1.0
0.9
Sadbhav Engineering
Neutral
319
-
5,471
3,823
4,426
10.7
10.8
10.3
11.8
31.0
27.0
3.7
3.3
10.1
10.5
1.7
1.5
NBCC
Neutral
269
-
24,219
9,099
12,706
6.4
6.4
7.3
9.6
37.0
28.1
1.6
1.3
27.5
30.5
2.5
1.8
MEP Infra
Neutral
101
-
1,640
2,403
2,910
18.3
16.8
2.4
6.1
42.9
16.6
16.3
11.0
35.2
55.8
1.8
1.5
SIPL
Neutral
129
-
4,533
2,060
2,390
46.8
47.7
(5.8)
(3.1)
4.8
5.5
(14.2)
(2.3)
7.0
6.5
Engineers India
Neutral
184
-
12,369
1,795
2,611
21.1
22.4
5.9
8.1
31.1
22.7
2.2
2.2
12.9
16.1
5.3
3.5
Financials
Axis Bank
Accumulate
542
580
129,951
32,558
35,843
3.5
3.2
27.8
41.0
19.5
13.2
2.1
1.9
11.4
14.9
-
-
Bank of Baroda
Neutral
184
-
42,293
22,533
26,079
2.4
2.4
12.0
20.9
15.3
8.8
1.0
0.9
6.6
11.0
-
-
Canara Bank
Neutral
388
-
23,202
17,925
20,235
2.0
2.1
18.5
36.5
21.0
10.6
0.8
0.8
3.4
6.2
-
-
Can Fin Homes
Neutral
478
-
6,362
586
741
3.5
3.5
107.8
141.0
4.4
3.4
1.0
0.8
24.1
25.6
-
-
Cholamandalam Inv. &
Neutral
1,276
-
19,940
2,826
3,307
6.3
6.3
53.7
64.6
23.8
19.8
4.1
3.5
18.3
18.9
-
-
Fin. Co.
Dewan Housing Finance Accumulate
636
712
19,930
2,676
3,383
2.4
2.7
37.4
49.7
17.0
12.8
2.2
2.0
13.8
16.2
-
-
Equitas Holdings
Buy
141
235
4,782
1,125
1,380
9.6
9.8
1.5
6.0
93.9
23.5
2.1
2.0
2.4
8.2
-
-
Federal Bank
Accumulate
113
125
22,025
4,896
5,930
2.8
3.1
5.4
7.6
21.0
14.9
1.8
1.6
8.5
11.0
-
-
Stock Watch
November 20, 2017
Company Name
Reco
CMP
Target
Mkt Cap
Sales ( Čcr )
OPM(%)
EPS (Č)
PER(x)
P/BV(x)
RoE(%)
EV/Sales(x)
(Č)
Price ( Č)
( Č cr )
FY18E FY19E
FY18E
FY19E
FY18E
FY19E
FY18E
FY19E
FY18E
FY19E
FY18E
FY19E
FY18E
FY19E
Financials
GIC Housing
Buy
439
655
2,362
376
477
3.6
3.7
33.0
40.0
13.3
11.0
2.4
2.0
20.0
23.0
-
-
HDFC Bank
Neutral
1,827
-
472,498
55,236
63,253
4.5
4.4
68.9
82.4
26.5
22.2
4.6
3.8
18.7
18.5
-
-
ICICI Bank
Neutral
325
-
208,679
42,361
51,378
3.6
3.9
18.4
25.7
17.7
12.6
1.9
1.9
11.3
15.0
-
-
Karur Vysya Bank
Buy
120
180
7,276
3,289
3,630
3.7
3.9
10.8
14.1
11.1
8.6
1.3
1.2
12.5
14.7
-
-
LIC Housing Finance
Neutral
605
-
30,522
4,895
6,332
3.4
3.7
50.7
66.8
11.9
9.1
2.4
2.0
21.7
23.8
-
-
Punjab Natl.Bank
Neutral
191
-
40,580
23,708
25,758
2.1
2.1
5.9
16.4
32.5
11.6
1.0
0.9
3.0
8.3
-
-
RBL Bank
Neutral
511
-
21,288
2,309
2,888
2.6
2.5
16.4
19.1
31.3
26.8
3.9
3.5
13.3
13.8
-
-
Repco Home Finance
Buy
621
825
3,887
496
597
4.4
4.2
38.5
48.7
16.2
12.8
2.9
2.4
19.6
20.6
-
-
South Ind.Bank
Neutral
31
-
5,521
3,195
3,567
3.0
3.1
3.0
3.8
10.1
8.0
1.0
0.9
10.5
11.9
-
-
St Bk of India
Neutral
337
-
291,246
105,827
121,056
2.4
2.5
16.1
25.6
21.0
13.2
1.6
1.5
6.6
9.9
-
-
Union Bank
Neutral
170
-
12,378
14,650
16,225
2.3
2.3
23.1
32.5
7.4
5.2
0.6
0.5
7.1
9.2
-
-
Yes Bank
Neutral
306
-
70,303
11,088
13,138
3.0
2.9
84.0
99.3
3.7
3.1
0.6
0.5
16.3
16.8
-
-
FMCG
Akzo Nobel India
Neutral
1,796
-
8,614
3,164
3,607
13.8
13.7
58.6
67.9
30.7
26.4
7.5
6.6
24.5
25.1
2.6
2.2
Asian Paints
Neutral
1,171
-
112,332
17,603
20,615
18.6
18.6
2,128.9
2,543.3
0.6
0.5
11.6
9.8
28.0
28.9
6.2
5.2
Britannia
Neutral
4,736
-
56,859
9,690
11,278
14.8
15.4
84.0
101.0
56.4
46.9
20.5
16.3
40.6
39.0
5.8
5.0
Colgate
Neutral
1,040
-
28,291
4,420
5,074
24.9
25.3
28.6
32.8
36.4
31.7
14.4
11.6
43.8
40.5
6.1
5.3
Dabur India
Neutral
337
-
59,302
8,346
9,344
19.6
19.9
7.8
9.0
43.2
37.4
8.7
7.9
25.2
24.8
6.7
5.9
GlaxoSmith Con*
Neutral
6,009
-
25,270
5,072
5,760
18.2
18.4
176.3
199.2
34.1
30.2
7.2
6.5
21.2
21.7
4.3
3.7
Godrej Consumer
Neutral
944
-
64,331
10,171
11,682
20.8
21.5
21.7
27.1
43.5
34.8
9.8
8.4
22.3
23.4
6.4
5.6
HUL
Neutral
1,279
-
276,750
37,077
41,508
20.3
21.8
5,189.9
6,318.5
0.3
0.2
39.0
33.3
74.8
82.0
7.3
6.5
ITC
Neutral
258
-
313,838
44,588
49,853
37.0
37.3
9.6
11.0
26.8
23.4
6.6
6.3
25.1
27.3
6.5
5.8
Marico
Neutral
306
-
39,549
6,788
7,766
18.5
19.2
7.1
8.5
43.2
36.1
15.1
12.9
36.9
38.0
5.7
4.9
Nestle*
Neutral
7,689
-
74,135
10,083
11,182
20.0
20.9
119.7
141.3
64.2
54.4
226.4
206.9
36.7
39.8
7.0
6.3
Tata Global
Neutral
260
-
16,378
7,121
7,641
11.9
12.3
6.9
8.0
37.6
32.4
2.5
2.4
6.8
7.2
2.1
1.9
Procter & Gamble
Neutral
9,100
-
29,540
3,034
3,579
27.1
27.7
167.7
198.8
54.3
45.8
14.6
12.5
28.8
29.5
9.2
7.7
Hygiene
IT
HCL Tech^
Buy
840
1,014
119,838
50,009
54,608
22.1
22.1
62.8
67.6
13.4
12.4
3.0
2.6
22.4
20.6
2.1
1.8
Infosys
Buy
971
1,120
223,027
70,333
75,960
26.0
26.0
61.7
65.9
15.7
14.7
3.0
2.8
18.9
18.7
2.6
2.3
TCS
Reduce
2,710
2,442
518,791
123,384
134,488
26.1
26.1
133.2
143.7
20.4
18.9
5.6
5.2
27.6
27.8
3.9
3.5
Tech Mahindra
Accumulate
485
526
47,364
30,545
32,988
15.0
15.0
35.2
37.6
13.8
12.9
2.3
2.2
16.8
16.2
1.3
1.2
Stock Watch
November 20, 2017
Company Name
Reco
CMP
Target
Mkt Cap
Sales ( Čcr )
OPM(%)
EPS (Č)
PER(x)
P/BV(x)
RoE(%)
EV/Sales(x)
(Č)
Price ( Č)
( Č cr )
FY18E FY19E
FY18E
FY19E
FY18E
FY19E
FY18E
FY19E
FY18E
FY19E
FY18E
FY19E
FY18E
FY19E
IT
Wipro
Neutral
295
-
143,446
54,164
56,544
22.3
22.3
18.8
19.5
15.7
15.1
2.5
2.2
15.0
13.6
1.9
1.6
Media
D B Corp
Neutral
368
-
6,769
2,404
2,625
30.5
31.5
23.7
26.9
15.5
13.7
3.7
3.1
23.5
22.8
2.7
2.4
HT Media
Neutral
96
-
2,240
2,589
2,830
15.1
15.4
8.3
10.9
11.6
8.8
0.9
0.9
8.4
10.4
0.4
0.3
Jagran Prakashan
Buy
162
225
5,281
2,541
2,835
28.5
28.7
12.7
14.1
12.7
11.5
2.6
2.3
21.3
21.4
1.9
1.7
Sun TV Network
Neutral
842
-
33,178
3,238
3,789
51.9
55.1
30.9
38.0
27.3
22.2
7.8
6.8
30.0
31.0
9.8
8.2
Hindustan Media
Neutral
242
-
1,779
1,002
1,074
23.3
23.5
29.2
33.8
8.3
7.2
1.3
1.1
15.6
15.4
0.8
0.5
Ventures
TV Today Network
Buy
357
435
2,130
667
727
27.7
27.7
18.6
20.1
19.2
17.8
3.0
3.1
15.6
17.3
2.7
2.5
Music Broadcast Limited Buy
365
434
2,085
271
317
91.0
109.0
6.0
10.0
60.9
36.5
3.8
3.5
6.5
9.3
7.3
6.0
Metals & Mining
Coal India
Neutral
273
-
169,369
82,301
91,235
17.0
18.0
17.1
20.5
16.0
13.3
3.0
2.8
45.0
55.0
1.7
1.5
Hind. Zinc
Neutral
311
-
131,302
22,108
24,555
57.0
58.0
22.1
26.3
14.1
11.8
4.6
3.7
32.0
35.0
4.9
4.1
Hindalco
Neutral
259
-
58,095
102,350
105,355
13.5
14.5
21.5
24.5
12.0
10.6
1.7
1.4
15.0
15.2
1.1
1.1
JSW Steel
Neutral
267
-
64,431
64,500
68,245
21.1
21.5
20.1
21.2
13.3
12.6
2.4
2.1
-
-
1.7
1.7
NMDC
Neutral
125
-
39,422
10,209
11,450
47.0
48.0
11.1
12.1
11.2
10.3
1.6
1.5
-
-
3.4
3.1
SAIL
Neutral
79
-
32,524
54,100
63,555
3.0
10.0
(10.0)
1.5
52.5
1.1
1.0
-
-
1.6
1.4
Vedanta
Neutral
308
-
114,341
81,206
87,345
28.0
29.0
26.5
33.5
11.6
9.2
2.6
2.3
-
-
2.2
1.8
Tata Steel
Neutral
701
-
68,116
121,445
126,500
16.2
17.2
65.4
81.3
10.7
8.6
1.7
1.5
-
-
1.1
1.0
Oil & Gas
GAIL
Neutral
445
-
75,187
53,115
52,344
14.2
15.3
30.0
31.1
14.8
14.3
1.9
1.7
-
-
1.1
1.1
ONGC
Neutral
178
-
227,790
83,111
84,934
44.2
44.9
16.4
16.9
10.8
10.5
1.3
1.2
-
-
2.6
2.6
Indian Oil Corp
Neutral
395
-
191,881
396,116
432,560
8.5
8.8
40.1
42.2
9.9
9.4
1.7
1.5
-
-
0.6
0.6
Reliance Industries
Neutral
910
-
591,651
257,711
267,438
17.0
18.2
89.1
89.5
10.2
10.2
1.0
0.9
-
-
2.0
1.9
Pharmaceuticals
Alembic Pharma
Buy
514
600
9,682
3,903
4,584
18.2
19.2
21.8
27.2
23.6
18.9
4.3
3.6
19.8
20.6
2.5
2.1
Alkem Laboratories Ltd
Accumulate
1,970
2,125
23,553
6,320
7,341
17.5
19.8
72.7
96.6
27.1
20.4
4.8
4.0
16.7
18.7
3.7
3.1
Aurobindo Pharma
Buy
708
823
41,463
17,086
19,478
22.1
22.0
44.7
51.4
15.8
13.8
3.5
2.8
24.7
22.7
2.5
2.2
Aventis*
Neutral
4,485
-
10,329
2,411
2,698
18.8
18.8
151.6
163.9
29.6
27.4
4.6
3.7
25.4
27.5
3.9
3.2
Cadila Healthcare
Neutral
446
-
45,695
11,584
13,228
20.3
20.4
18.7
21.3
23.9
21.0
5.3
4.4
24.6
22.9
3.8
3.2
Cipla
Sell
609
462
48,978
16,163
18,711
16.6
16.9
20.7
24.3
29.4
25.1
3.5
3.1
12.6
13.1
3.2
2.7
Dr Reddy's
Neutral
2,325
-
38,555
15,844
17,973
17.6
18.2
91.7
111.0
25.4
21.0
2.9
2.6
11.9
13.0
2.6
2.4
GSK Pharma*
Neutral
2,511
-
21,272
2,968
3,324
13.8
15.9
37.8
46.3
66.4
54.2
11.6
12.8
16.7
22.4
7.0
6.4
Indoco Remedies
Sell
267
153
2,465
1,154
1,310
14.9
14.9
11.3
12.7
23.7
21.1
3.4
3.0
15.0
15.0
2.3
1.9
Stock Watch
November 20, 2017
Company Name
Reco
CMP
Target
Mkt Cap
Sales ( Čcr )
OPM(%)
EPS (Č)
PER(x)
P/BV(x)
RoE(%)
EV/Sales(x)
(Č)
Price ( Č)
( Č cr )
FY18E FY19E
FY18E
FY19E
FY18E
FY19E
FY18E
FY19E
FY18E
FY19E
FY18E
FY19E
FY18E
FY19E
Pharmaceuticals
Ipca labs
Neutral
529
-
6,679
3,593
4,022
14.5
15.5
19.4
25.2
27.3
21.0
2.5
2.2
9.5
11.2
1.9
1.7
Lupin
Buy
829
1,091
37,482
16,240
18,562
21.3
21.7
42.5
49.6
19.5
16.7
2.5
2.2
13.3
13.7
2.4
2.0
Natco Pharma
Buy
901
1,057
15,713
1,886
2,016
32.3
29.5
23.2
22.0
38.9
40.9
8.1
7.2
20.9
17.6
8.2
7.6
Sun Pharma
Accumulate
517
558
124,053
32,899
36,451
26.9
25.4
31.6
32.3
16.4
16.0
2.9
2.5
18.7
18.8
3.4
2.9
Syngene International
Accumulate
515
556
10,295
1,394
1,818
33.0
36.0
15.8
20.6
32.5
25.0
6.1
5.0
18.6
20.0
7.4
5.6
Power
Tata Power
Neutral
89
-
24,059
32,547
33,806
20.5
20.5
4.7
5.4
18.9
16.6
1.8
1.6
10.5
10.5
1.7
1.7
NTPC
Neutral
177
-
146,316
86,070
101,246
28.3
30.7
12.9
16.2
13.8
11.0
1.4
1.3
10.6
12.4
3.1
2.7
Power Grid
Accumulate
209
223
109,105
29,183
32,946
89.7
90.0
18.0
20.8
11.6
10.0
1.9
1.7
17.7
18.2
7.7
7.1
Real Estate
Prestige Estate
Neutral
306
-
11,483
4,607
5,146
21.0
22.2
7.9
9.8
38.8
31.2
2.4
2.2
10.3
12.0
3.7
3.3
MLIFE
Buy
449
522
2,302
487
590
12.3
17.8
21.0
31.2
21.4
14.4
1.1
1.1
5.2
7.4
3.4
2.8
Telecom
Bharti Airtel
Neutral
494
-
197,292
97,903
105,233
36.0
36.3
9.3
11.1
53.1
44.7
2.6
2.4
5.0
5.6
3.0
2.7
Idea Cellular
Neutral
95
-
34,341
35,012
37,689
27.1
27.7
(4.4)
(2.7)
1.5
1.5
(6.8)
(4.6)
2.3
2.1
zOthers
Abbott India
Neutral
4,942
-
10,501
3,244
3,723
14.9
16.1
167.5
209.4
29.5
23.6
6.5
5.4
23.7
24.8
2.9
2.4
Asian Granito
Buy
490
570
1,473
1,169
1,286
12.5
12.5
16.0
19.7
30.7
24.8
3.3
2.9
10.7
11.6
1.5
1.3
Bajaj Electricals
Neutral
400
-
4,067
4,646
5,301
6.7
7.6
16.1
22.3
24.8
17.9
4.1
3.5
16.4
19.2
0.9
0.8
Banco Products (India)
Neutral
221
-
1,580
1,530
1,695
13.2
12.7
19.0
20.0
11.6
11.0
1.9
1.6
0.2
0.2
0.9
104.8
Coffee Day Enterprises
Neutral
226
-
4,652
3,494
3,913
17.4
18.0
4.8
5.7
-
39.6
2.0
1.9
-
0.1
1.8
1.6
Ltd
Elecon Engineering
Neutral
74
-
833
171
201
15.0
16.2
36.0
43.0
2.1
1.7
0.2
0.2
0.1
0.1
4.2
3.6
Garware Wall Ropes
Neutral
905
-
1,981
928
1,003
15.2
15.2
39.4
43.2
23.0
21.0
3.8
3.2
16.5
15.4
2.0
1.8
Goodyear India*
Neutral
828
-
1,910
1,717
1,866
11.8
12.3
47.9
49.8
17.3
16.6
2.7
2.3
15.6
15.7
0.8
115.7
Hitachi
Neutral
2,450
-
6,661
2,355
2,715
10.3
10.8
49.0
60.9
50.0
40.2
11.7
9.3
0.2
0.2
2.9
2.5
HSIL
Neutral
463
-
3,345
2,240
2,670
14.6
15.0
17.0
22.0
27.2
21.0
2.2
2.1
0.1
0.1
1.7
1.4
Interglobe Aviation
Neutral
1,165
-
44,754
22,570
27,955
14.2
15.0
63.6
81.8
18.3
14.3
9.7
8.1
0.5
0.6
1.7
1.3
Jyothy Laboratories
Neutral
335
-
6,090
1,781
2,044
14.1
15.0
9.4
10.5
35.8
31.9
7.6
7.2
0.2
0.2
3.6
3.1
Linc Pen & Plastics
Neutral
257
-
380
420
462
9.3
9.3
15.3
17.1
16.8
15.0
2.8
2.9
16.9
19.5
1.0
0.9
M M Forgings
Neutral
856
-
1,033
542
642
20.1
21.0
41.6
56.8
20.6
15.1
2.8
2.4
0.1
0.2
2.3
2.0
Mirza International
Neutral
152
-
1,828
1,148
1,285
18.0
18.0
8.0
9.4
18.9
16.3
3.1
2.6
16.3
16.1
1.8
1.5
Navkar Corporation
Buy
181
265
2,718
561
617
41.5
41.5
11.5
12.7
15.7
14.2
1.7
1.5
10.5
10.4
5.5
4.8
Nilkamal
Neutral
1,587
-
2,368
2,317
2,525
11.4
11.1
96.0
105.0
16.5
15.1
2.8
2.4
0.2
0.2
1.0
0.9
Stock Watch
November 20, 2017
Company Name
Reco
CMP
Target Mkt Cap
Sales ( Čcr )
OPM(%)
EPS (Č)
PER(x)
P/BV(x)
RoE(%)
EV/Sales(x)
(Č)
Price ( Č)
( Č cr )
FY18E FY19E FY18E FY19E FY18E FY19E FY18E FY19E FY18E FY19E FY18E FY19E FY18E FY19E
zOthers
Parag Milk Foods
Neutral
234
-
1,967
1,987
2,379
7.6
9.0
12.4
18.3
18.9
12.8
2.7
2.3
8.2
13.2
1.1
0.9
Radico Khaitan
Neutral
257
-
3,420
1,811
1,992
13.2
13.2
8.1
8.8
31.7
29.2
3.2
3.5
10.1
12.0
2.2
2.0
Relaxo Footwears
Neutral
574
-
6,895
1,981
2,310
13.7
14.5
12.0
15.5
47.8
37.0
9.3
7.5
0.2
0.2
3.5
3.0
Siyaram Silk Mills
Accumulate
573
650
2,687
1,769
1,981
12.7
12.7
22.6
26.2
25.3
21.9
3.9
3.4
15.5
15.5
1.7
1.5
Styrolution ABS India* Neutral
916
-
1,611
1,800
1,980
8.0
8.1
42.0
46.2
21.8
19.8
2.4
2.2
0.1
0.1
1.0
0.9
Surya Roshni
Neutral
380
-
1,664
4,870
5,320
7.7
7.8
22.8
28.1
16.7
13.5
2.2
1.9
0.1
0.1
0.6
0.5
TVS Srichakra
Neutral
3,301
-
2,527
2,729
2,893
12.7
12.5
248.5
265.0
13.3
12.5
3.8
3.1
0.3
0.3
0.9
0.9
Visaka Industries
Neutral
642
-
1,020
1,104
1,214
12.1
12.6
31.0
37.9
20.7
17.0
2.5
2.3
0.1
0.1
1.2
1.0
VIP Industries
Neutral
314
-
4,437
1,450
1,693
10.4
10.5
6.5
7.8
48.0
40.2
10.1
8.9
21.1
22.1
3.0
2.6
Navin Fluorine
Accumulate
686
730
3,384
945
1,154
22.4
22.6
28.7
34.8
23.9
19.8
4.0
3.4
-
-
3.1
2.4
Source: Company, Angel Research; Note: *December year end; #September year end; &October year end; Price as on November 18, 2017
Market Outlook
November 20, 2017
Research Team Tel: 022 - 39357800
DISCLAIMER
Angel Broking Private Limited (hereinafter referred to as “Angel”) is a registered Member of National Stock Exchange of India
Limited,Bombay Stock Exchange Limited and Metropolitan Stock Exchange Limited. It is also registered as a Depository Participant with
CDSL and Portfolio Manager with SEBI. It also has registration with AMFI as a Mutual Fund Distributor. Angel Broking Private Limited is a
registered entity with SEBI for Research Analyst in terms of SEBI (Research Analyst) Regulations, 2014 vide registration number
INH000000164. Angel or its associates has not been debarred/ suspended by SEBI or any other regulatory authority for accessing
/dealing in securities Market. Angel or its associates/analyst has not received any compensation / managed or
co-managed public offering of securities of the company covered by Analyst during the past twelve months.
This document is solely for the personal information of the recipient, and must not be singularly used as the basis of any investment
decision. Nothing in this document should be construed as investment or financial advice. Each recipient of this document should make
such investigations as they deem necessary to arrive at an independent evaluation of an investment in the securities of the companies
referred to in this document (including the merits and risks involved), and should consult their own advisors to determine the merits and
risks of such an investment.
Reports based on technical and derivative analysis center on studying charts of a stock's price movement, outstanding positions and
trading volume, as opposed to focusing on a company's fundamentals and, as such, may not match with a report on a company's
fundamentals. Investors are advised to refer the Fundamental and Technical Research Reports available on our website to evaluate the
contrary view, if any.
The information in this document has been printed on the basis of publicly available information, internal data and other reliable
sources believed to be true, but we do not represent that it is accurate or complete and it should not be relied on as such, as this
document is for general guidance only. Angel Broking Pvt. Limited or any of its affiliates/ group companies shall not be in any way
responsible for any loss or damage that may arise to any person from any inadvertent error in the information contained in this report.
Angel Broking Pvt. Limited has not independently verified all the information contained within this document. Accordingly, we cannot
testify, nor make any representation or warranty, express or implied, to the accuracy, contents or data contained within this document.
While Angel Broking Pvt. Limited endeavors to update on a reasonable basis the information discussed in this material, there may be
regulatory, compliance, or other reasons that prevent us from doing so.
This document is being supplied to you solely for your information, and its contents, information or data may not be reproduced,
redistributed or passed on, directly or indirectly.
Neither Angel Broking Pvt. Limited, nor its directors, employees or affiliates shall be liable for any loss or damage that may arise from
or in connection with the use of this information.